The Run Workflow button
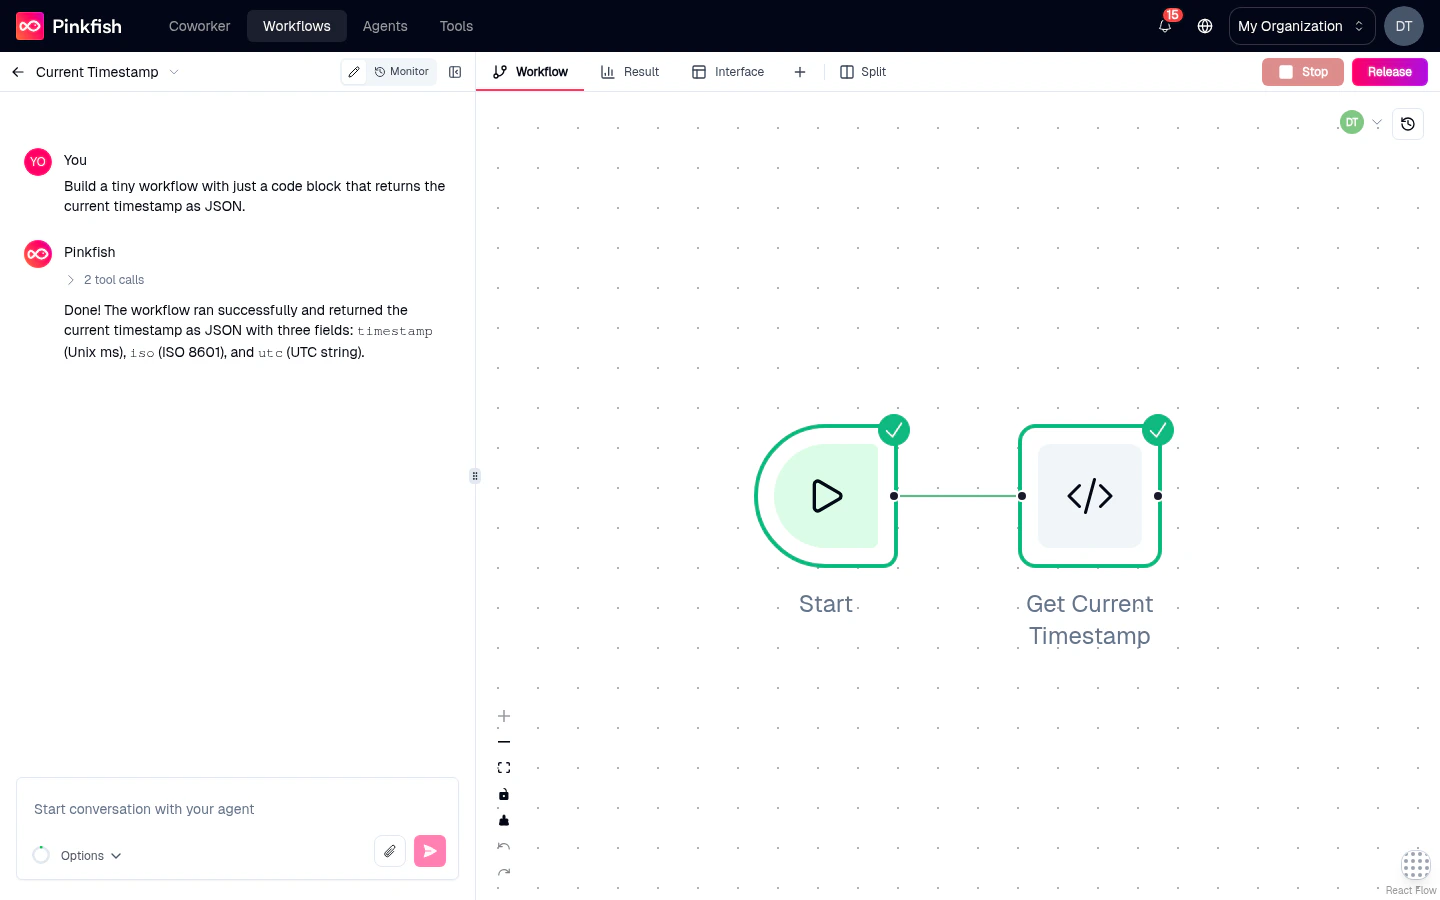
The green Run Workflow button sits in the tab bar at the top-right of the editor. Clicking it:- Resolves which trigger to use (the selected trigger node, or the Manual trigger by default).
- If the trigger has an input schema, opens an Input Dialog to collect values.
- Fires the workflow and streams status back to the canvas and Log tab.
The Input Dialog
When the selected trigger has fields (an input schema), clicking Run Workflow opens a dialog pre-populated with their types. Fill in your test values and click Run to fire. You can reopen the dialog without re-running via the Show Inputs button that appears next to Run on the canvas when inputs are present — handy for editing values and re-running with tweaks.Calling an API trigger
For API triggers, open the Call API Trigger modal (accessible from the trigger’s context menu or via the run control). It generates a ready-to-sendcurl command with:
- The trigger’s draft or live URL.
- The correct auth header.
- A pretty-printed JSON body editor.
Running from the canvas
Right-click a node and choose:- Run entire workflow (on a trigger) — fires the full workflow from that trigger.
- Run until this node (on a non-trigger) — runs the workflow from its trigger up to and including the right-clicked node, then stops. Invaluable for iterating on a specific step.
Triggered runs
When an external event (an API call, an email, a schedule, an app trigger) fires the workflow while the editor is open, Pinkfish shows a Triggered Run Notice — a small toast/badge in the header. Click it to open the triggered run in the editor and watch its state live. The Triggered Runs button next to the Run button shows a popover of recent triggered executions, so you can jump to any of them without switching to the full Monitor view.Live execution feedback
As the workflow runs, you’ll see feedback in multiple places:- Canvas — each node lights up with its status: pending → running → success/error/skipped. See Canvas: Node status indicators.
- Log tab — streaming log entries from every node (tool calls, code block stdout, errors).
- Result tab — the selected node’s output updates as soon as that node completes.
- Runtime error banner — if the workflow fails, a banner appears at the top of the canvas linking to the failing node.
Batch runs
Need to run the workflow with a bunch of different inputs at once? Open the Batch Options modal from the chat input’s batch icon. Configure:- Parameter set — a CSV-like table of inputs, one row per run.
- Concurrency — how many runs execute in parallel.
- Fail-fast — stop the batch as soon as one run fails (vs. continue).
Mock vs. live execution
By default, every node hits the real world — real API calls, real files written, real emails sent. For safer iteration, toggle specific nodes into Mock mode to return synthetic data instead. See Mock mode & pinning for the full feature, including the release-gate caveat.Auto-heal
When a node fails, the coding agent can often propose a fix automatically. Pinkfish surfaces an Auto-heal suggestion on failed runs — click it and the agent revises the offending node’s configuration or code and reruns from that point. Useful for flaky tool calls, schema mismatches, and similar self-correctable errors.Test data warning
Before you release the workflow, Pinkfish may prompt you with a Test Data Warning Dialog if it detects you’ve only run with test inputs. The warning is a gentle nudge to validate against realistic data before promoting to live.Browser sessions during runs
If your workflow uses browser automation, you’ll see a live browser view embedded in the Browser Session panel of the chat. The agent’s clicks and typing stream in real-time so you can debug selector issues without re-running. See Browser Logins for managing browser connections.What’s next
Mock mode & pinning
Iterate faster by mocking expensive nodes and pinning outputs.
Monitor tab
Review past runs, debug errors, and inspect execution traces.
Releases
Promote a successful live run into a versioned release.
Triggers
Configure the triggers you’re calling.