- “Why did the agent pick that tool?”
- “What parameters did it actually pass?”
- “Did a tool call return an error that the user didn’t see in the surfaced reply?”
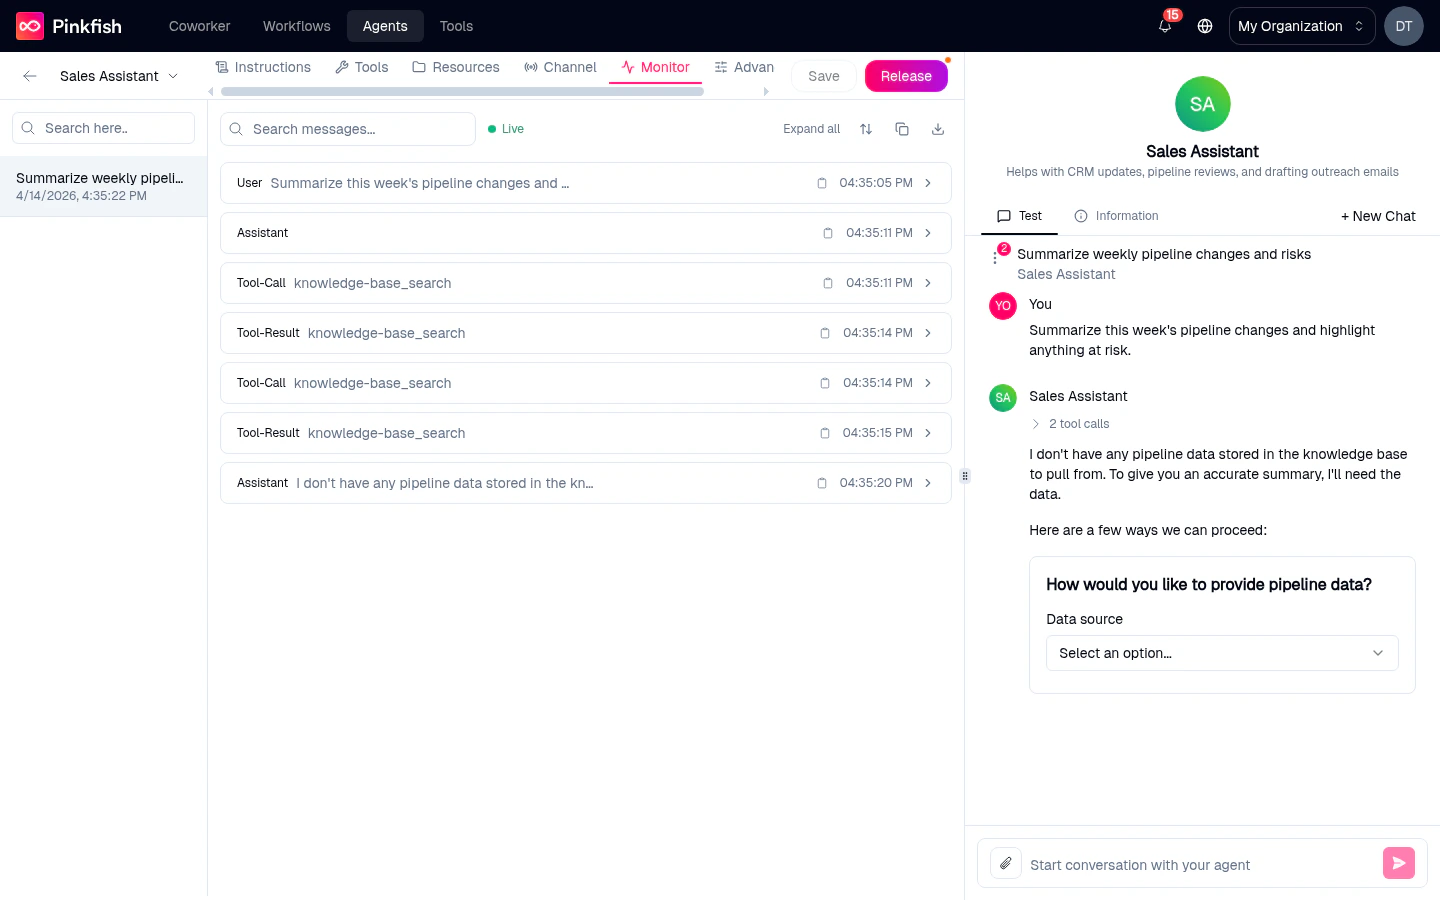
Layout
The tab has two panes.Left — chat list
Every chat this agent has been part of, newest first by default.- Search here… — filter the list by chat title.
- Sort order arrow — flip between newest-first and oldest-first.
- Empty state: “No chats found.” when the search doesn’t match, or the agent simply has no chats yet.
Right — message viewer
The full message thread for the selected chat.- Search messages… — filter the thread for a keyword.
- Expand all — expand every tool-call block at once.
- Message actions (top-right icons) — copy / download controls for the selected thread.
No Chat Selected Select a chat from the list to view monitor activity.If the selected chat has no content yet:
No Messages Found This chat doesn’t have any messages yet. Start a conversation in the preview panel to see monitor information.
Parsed message details
The viewer parses each message to surface the agent’s internal work, not just the final reply. Expect to see, per message:- The tool name the agent called.
- The parameters it passed.
- The result (or the error, if the call failed).
- The model’s reasoning text when the model supports it.
When to use this vs the org-wide Monitor
| Use the in-builder Monitor tab when… | Use the org-wide Agent Monitor when… |
|---|---|
| You’re iterating on a single agent | You’re doing analytics or capacity planning across many agents |
| You want to drill from “this run failed” to “this parameter was wrong” | You want to see usage trends or who is chatting with what |
| You need to see ephemeral tool errors the user didn’t surface | You want to customize columns, date ranges, and export data |
Tips
- Pin the Monitor tab before you start iterating. Clicking + on the tab strip lets you pin it so you can pivot between Instructions → Tools → Monitor quickly.
- While debugging, run the same prompt twice in the Preview pane: once before a change, once after. The two runs sit side-by-side in Monitor, making regressions easy to spot.
- If you’ve published a release, you can see Coworker / Slack / Teams conversations the same way — they’re all just chats tied to the agent.
Related
- Agent Monitor — the org-wide version.
- Tools tab — where you change what the agent can call once the Monitor tells you it’s calling the wrong thing.
- Advanced tab — force structured responses if you’re hitting free-text parsing issues.